Unoffical empeg BBS

Quick Links: Empeg FAQ | RioCar.Org | Hijack | BigDisk Builder | jEmplode | emphatic
Repairs: Repairs

Topic Options
#166122 - 16/06/2003 10:15 plot points in a line
RobotCaleb
pooh-bah

Registered: 15/01/2002
Posts: 1866
Loc: Austin
whats a good formula to plot all the points between two points?
i need to check the color of points between two points in a straight line from point to point.

Top
#166123 - 16/06/2003 10:35 Re: plot points in a line [Re: RobotCaleb]
CrackersMcCheese
pooh-bah

Registered: 14/01/2002
Posts: 2489
You talking linear trends? y = mx + c and r values and all that? Excel will do this.

'x' and 'y' are the coordinates of the points that satisfy the function and so lie on the straight line graph.

'm' is the gradient of the straight line graph, and

'c' is the 'y intercept' of the straight line graph.


Sorry if this is waaaaay off what you mean!

Top
#166124 - 16/06/2003 12:25 Re: plot points in a line [Re: RobotCaleb]
trs24
old hand

Registered: 20/03/2002
Posts: 729
Loc: Palo Alto, CA
whats a good formula to plot all the points between two points?
Wouldn't plotting those points take... well... forever?
_________________________
- trs

Top
#166125 - 16/06/2003 12:45 Re: plot points in a line [Re: trs24]
mtempsch
pooh-bah

Registered: 02/06/2000
Posts: 1996
Loc: Gothenburg, Sweden
Wouldn't plotting those points take... well... forever?

Heh, that was my first thought for a reply also...

i need to check the color of points between two points in a straight line from point to point.

But I'll assume all integer pairs creating a line between say (1;3) and (25;6). Sounds like he has a generated matrix with color values that he needs to check.

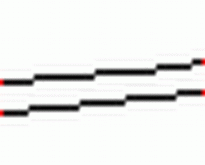
If we move from 1 to 25 in x-direction, somewhere the line will "step up" from 3 to 4, 4 to 5 and 5 to 6. I'd suspect that if there was some mathematical function resulting in those dots beeing draw, the exact point for the "steps" can vary depending on roundings. Ie, did the 3 in (1;3) become a three because it was actually just larger than 2.5, or is it 3 because it was just slightly less than 3.5? See pic below for the idea.


Became pretty poor as I scaled it, but the idea should come through. The red points are at the same x and y distance in both cases, but the "route" is slightly different.


/Michael


Attachments
164242-lines.GIF (57 downloads)

_________________________
/Michael

Top
#166126 - 16/06/2003 16:43 Re: plot points in a line [Re: mtempsch]
RobotCaleb
pooh-bah

Registered: 15/01/2002
Posts: 1866
Loc: Austin
k, heres what i got so far

i find the distance between the two points
i use that as my counter, roughly that should be how many pixels will be between these points.
then i find the rise over run using the same numbers i did in the distance formula. i convert this rise over run to two numbers. one being smaller than one and one being equal to one by dividing both numbers by the larger.
i then check the pixels at all the points in between by adding the new rise and run to the current/last drawn point.
if that makes sense

the problem i run into is the line drawn/checked ends up going further than the points checked, which kinda makes sense as the counter doesnt necessarily equal the number of drawn points.

i dont have the exact code handy to post here.

Top
#166127 - 16/06/2003 21:42 Re: plot points in a line [Re: RobotCaleb]
mtempsch
pooh-bah

Registered: 02/06/2000
Posts: 1996
Loc: Gothenburg, Sweden
For what you're doing it sounds like you want to find the distances in x and y direction, then loop over whichever is larger (say delta_x > delta_y) - this to limit rounding errors - and then step off in that direction, "stepping up" when you've gone delta_x/delta_y pixels (might be a -1 needed somewhere in these formulas - too early for creative thinking) .

But I believe this is susceptible to the problem in my last post, in case the pixels you're checking has been determined by some other function. If you're merely painting pixels in a line between 2 points, this should work OK...

/Michael
_________________________
/Michael

Top
#166128 - 16/06/2003 23:13 Re: plot points in a line [Re: mtempsch]
gbeer
carpal tunnel

Registered: 17/12/2000
Posts: 2665
Loc: Manteca, California
You'll have to translate to whatever the proper syntax for the coding you use. Its a start and possibly buggy.

This shouldn't care what order the points are given in or which direction the slope is.

glenn

start point = (x1,y1)
end point = (x2,y2)

xdir=(x1-x2)/abs(x1-x2)
ydir=(y1-y2)/abs(y1-y2)

rise=abs(y1-y2)
run=abs(x1-x2)
slope=rise/run
count=0

if run>=rise
do until count=x2
check pixel at (x1,y1)
count=count+xdir
x1=x1+xdir
y1=int(y1+slope*count) < buggy
end
else
do until count=y2
check pixel at (x1,y1)
count=count+xdir
y1=y1+ydir
x1=int(x1+(1/slope)*count) <buggy
end
endif

edit: yep it's buggy but its bed time. There is always tommorrow


Edited by gbeer (16/06/2003 23:19)
_________________________
Glenn

Top
#166129 - 17/06/2003 10:20 Re: plot points in a line [Re: gbeer]
RobotCaleb
pooh-bah

Registered: 15/01/2002
Posts: 1866
Loc: Austin
thanks, ill see what i can do with that.
whats the great error with my logic above?

Top